![]()
Introduction
The economic development of Europe proceeded political consolidation and differentiation. As large sovereignties emerged and state regulation superseded guild and municipal regulation, economic development could extend freely over a wider territories. Between 1270 and 1870 England and Great Britain slowly progressed from the periphery of the European economy to centre-stage of an integrated global economy. In the process Britain escaped the Malthusian trap and by the eighteenth century had successfully reconciled a rising population with a rising standard of living. The following is a short article and demo which explores data published by the Bank of England. The dataset contains a broad set of macroeconomic and financial indicators from England and Great Britain stretching back to the 13th century.
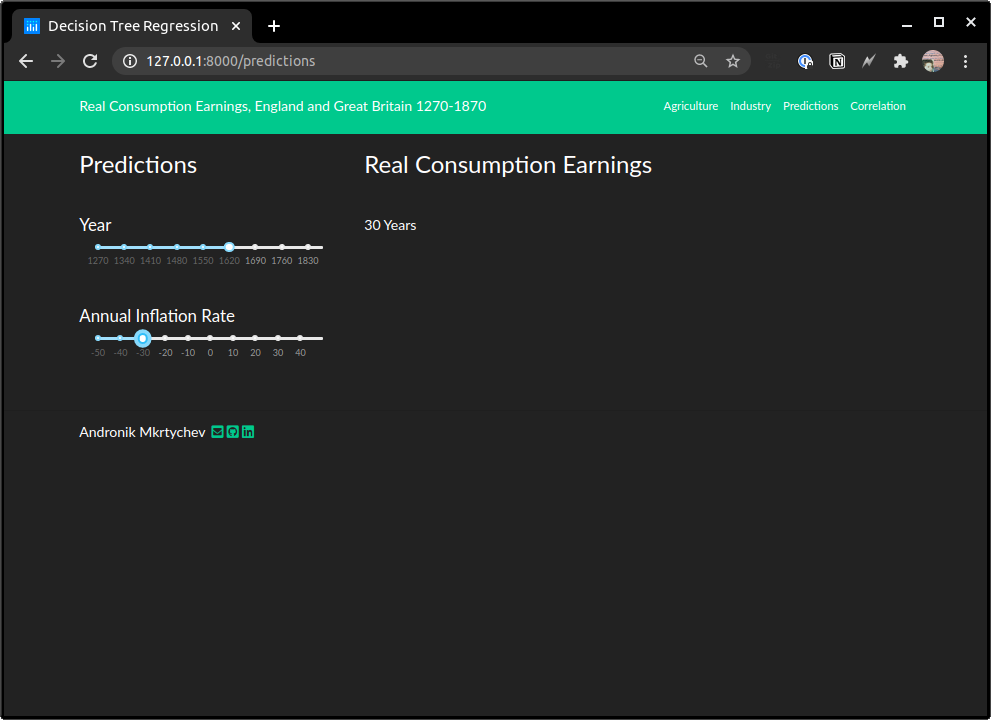
Model and Metric
Real consumption earnings was modeled using a decision tree regressor which breaks down a data-set into smaller and smaller subsets while at the same time an association tree is incrementally developed. This method of analysis resulted in a validation accuracy of 0.641 which suggests that the percentage of correct classifications using this model was approximately 64.1%.
# imported libraries
from sklearn.impute import SimpleImputer
from sklearn.pipeline import make_pipeline
from sklearn.tree import DecisionTreeRegressor

# target
target = 'Real_consumption_earnings_Growth_GB'

# drop target feature
train_features = train.drop(columns=[target,'Growth_consumption_earnings','Consumer_price_inflation'])

# get list of numeric features
numeric_features = train_features.select_dtypes(include='number').columns.tolist()

# combine numeric features
features = numeric_features

# Arrange data into X features matrix and y target vector
X_train = train[features]
y_train = train[target]
X_val = val[features]
y_val = val[target]
X_test = test[features]

# pipeline
pipeline = make_pipeline(
    SimpleImputer(missing_values=np.nan , strategy='median'),
    DecisionTreeRegressor(max_depth=2)
)

# pipeline fit and validtion score
pipeline.fit(X_train, y_train)
print('Validation Accuracy', pipeline.score(X_val, y_val))