The economic development of Europe proceeded political consolidation and differentiation. As large sovereignties emerged and state regulation superseded guild and municipal regulation, economic development could extend freely over a wider territories. Between 1270 and 1870 England and Great Britain slowly progressed from the periphery of the European economy to centre-stage of an integrated global economy. In the process Britain escaped the Malthusian trap and by the eighteenth century had successfully reconciled a rising population with a rising standard of living. The following article explores data published by the Bank of England. The data-set contains a broad set of macroeconomic and financial indicators from England and Great Britain stretching back in some cases to the C13th.
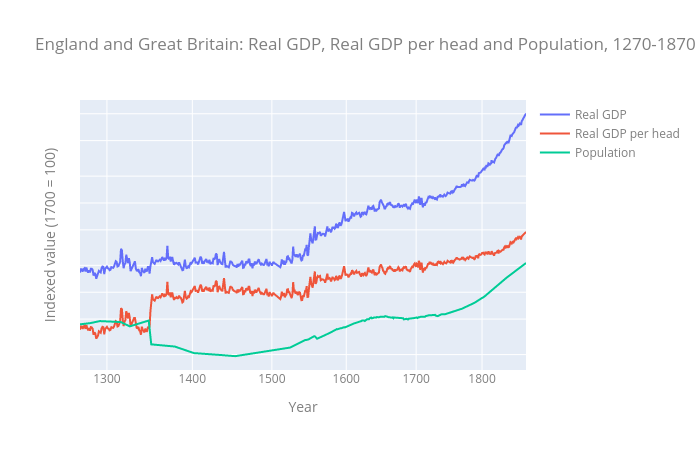
Figure 1 shows the broad trends in population, real GDP and real GDP per head for England from 1270 to 1700 and Great Britain from 1700 to 1870, which is indexed to provide a continuous series. The changes observed over 600 years occurred slowly but with a cumulative effect which is quite impressive. Figure 1 shows a five-fold growth in population, a twenty-eight-fold growth in GDP and a 5.7 fold growth in GDP per head. Progress was episodic and happened in approximately five phases, including the period between 1270 to the outbreak of the Black Death in 1348.
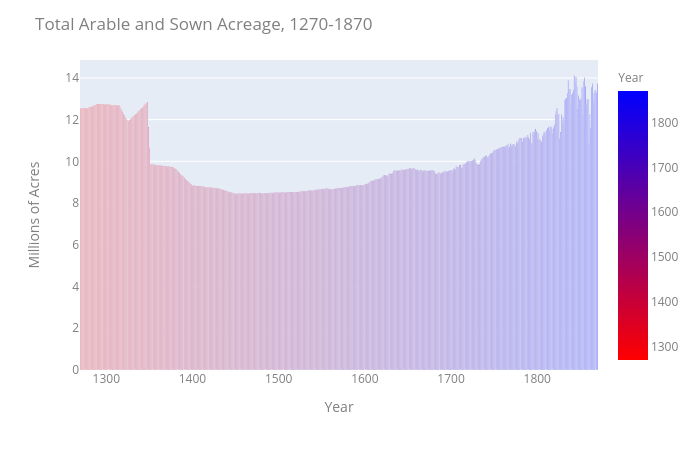
Unsurprisingly, farmers expanded or reduced their output, altered its composition, raised or lowered the intensity of production in accordance to changes in demand. Following the Black Death, there were fewer mouths to feed, people to cloth and hands to be employed, agricultural output contracted. Re-expansion took place following population growth in the sixteenth century and continued rising in the seventeenth and eighteenth century. Agricultural historians have expended great energy debating which of theses episodes of population growth, rising yields and expanding outputs constituted an Agricultural Revolution, as well as the technological, institutional and economic sources which would explain the productivity gains shown in Figure 2.
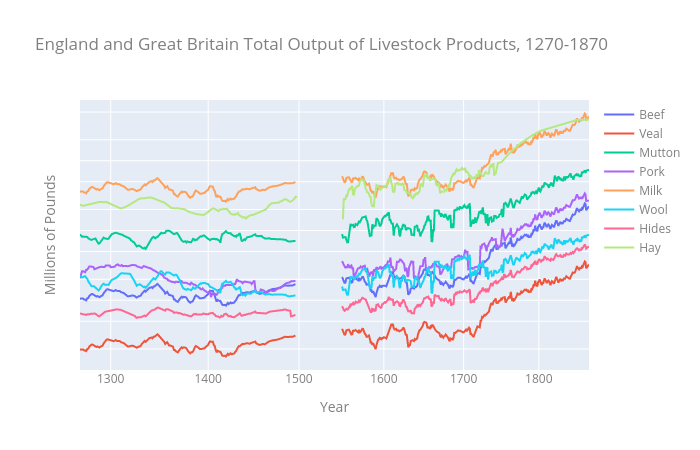
From the mid-sixteenth century rising demand from a fast growing population stimulated a sustained re-expansion of agricultural output as well as livestock output, with arable land growth initially outpacing that of the livestock sector. From the mid-seventeenth century, population pressure eased, livestock output growth accelerated and significantly remained ahead of that of the arable sector throughout the eighteenth century notwithstanding the resumption of population growth. This was made possible by a new integrated mixed-farming systems of the agricultural revolution. Figure 3 shows the total output of livestock products in millions of pounds, gallons and tons.
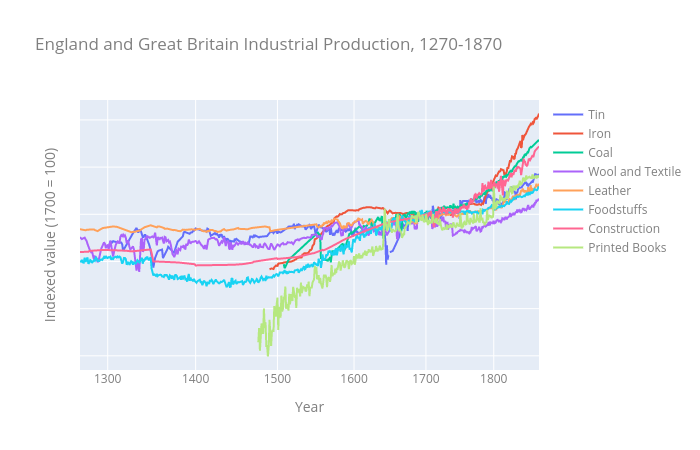
Output of the industrial and service sectors achieved their late medieval peaks at the opening of the fourteenth century and thereafter contracted respectfully over this same period as the population halved. Between 1450 and 1700 English industrial output grew more than five-fold, while output per head doubled. This is largely due to structural redistribution of labor from agriculture to industry. Output grew consistently faster than the population throughout the sixteenth century, as metal and mining output fluctuated but nevertheless held up well, while textile production prospered, and the Reformation boosted demand for the printed book.
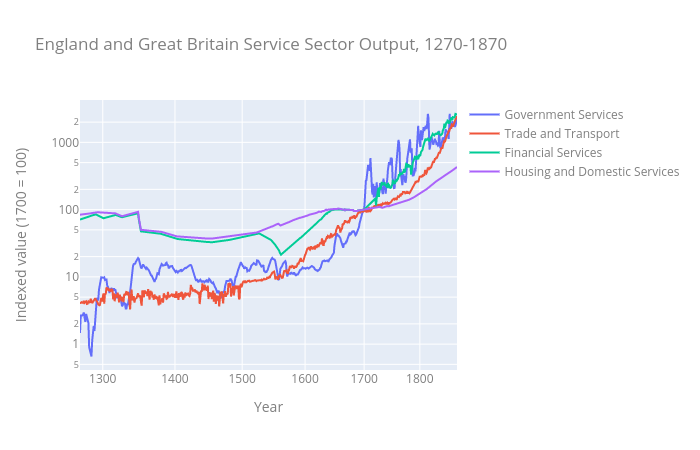
The service sector has received much less attention from economic historians than agriculture and industry. Government was fundamentally important in determining the institutional infrastructure at national, regional and local levels within which economic activity took place. With the exception of the period between 1350 to 1450, when revenues from the Crown estate declined and there was little direct taxation, government revenues and services displayed a powerful tendency to rise. As economic expansion gathered momentum, trade and transport emerged as one of the most dynamic sectors of the economy. Growing at an annual average of 1.2 percent until the end of the seventeenth century. Figure 6 shows how over the centuries, financial sector output expanded and contracted with money supply, the availability of credit and the advent of institutional innovations in the instruments and methods of exchange. Finally, housing and domestic services have always formed a large part of the service sector output to almost half in 1700 and a third in 1840.
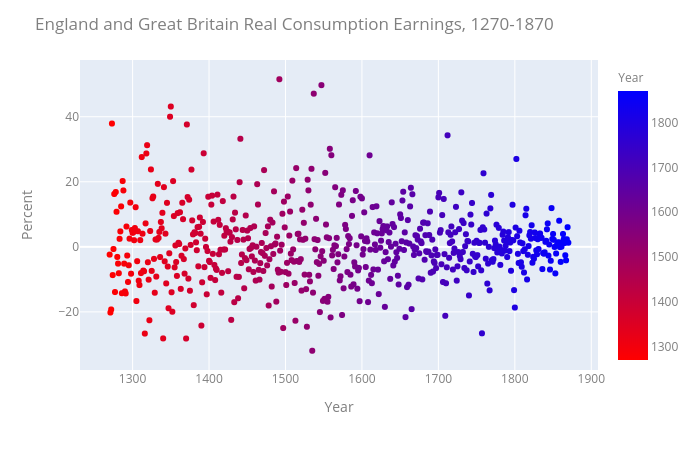
While the European dimension of development await further investigation, it is already clear that the relationship between real consumer earnings, GDP per head and annual inflation rate are far more complex than usually appreciated. Patently, for good reason, labor supply per head was anything but constant over time. While exploring the data-set real consumption earnings, determined by income and changes in income, stood out as a feature important enough to explore further using machine learning techniques.
# imported libraries
from sklearn.impute import SimpleImputer
from sklearn.pipeline import make_pipeline
from sklearn.tree import DecisionTreeRegressor

# target
target = 'Real_consumption_earnings_Growth_GB'

# drop target feature
train_features = train.drop(columns=[target,'Growth_consumption_earnings','Consumer_price_inflation'])

# get list of numeric features
numeric_features = train_features.select_dtypes(include='number').columns.tolist()

# combine numeric features
features = numeric_features

# Arrange data into X features matrix and y target vector
X_train = train[features]
y_train = train[target]
X_val = val[features]
y_val = val[target]
X_test = test[features]

# pipeline
pipeline = make_pipeline(
    SimpleImputer(missing_values=np.nan , strategy='median'),
    DecisionTreeRegressor(max_depth=2)
)

# pipeline fit and validtion score
pipeline.fit(X_train, y_train)
print('Validation Accuracy', pipeline.score(X_val, y_val))
Real consumption earnings was modeled using a decision tree regressor which breaks down a data-set into smaller and smaller subsets while at the same time an association tree is incrementally developed. This method of analysis resulted in a validation accuracy of 0.641 which suggests that the percentage of correct classifications using this model was approximately 64.1%.
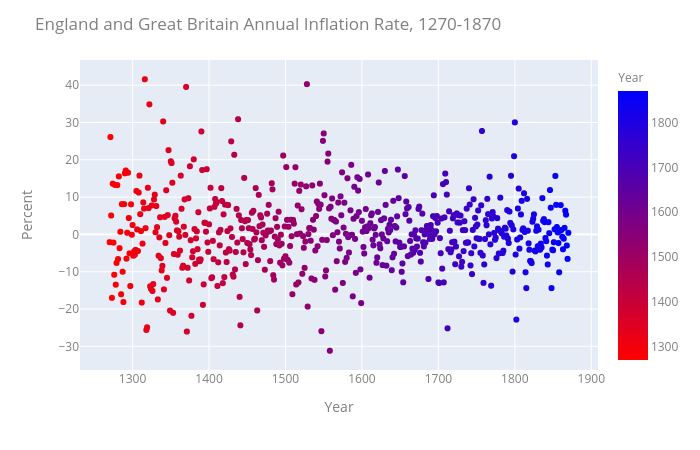
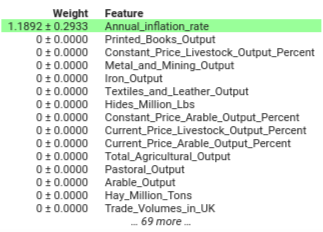
In addition, it was determined that annual inflation rate, in particular, was a feature in the data-set that weighted most heavily on validation accuracy after the permutation importance was calculated. According to the decision tree regressor, real consumption earnings is significantly influenced by annual inflation rate.
Annual inflation rate experienced volatility post-Black Death and Tudor inflation which caused a sharp financial set-back. However, overtime as volatility in annual inflation rate stabilized so did real consumption earnings. This stabilization in consumption earnings decreased the volatility in prices consumers experienced in the market place. It would require further analysis and exploration in the causes and effects that determine annual inflation rates to unpack the full complexity of this fascination story.
Reference
- Broadberry, S., Campbell, B., Klein, A., Overton, M., & Van Leeuwen, B. (2015). British Economic Growth, 1270–1870. Cambridge: Cambridge University Press. doi:10.1017/CBO9781107707603
- “Sklearn.tree.DecisionTreeRegressor.” Scikit, scikit-learn.org/stable/modules/generated/sklearn.tree.DecisionTreeRegressor.html.
- “A Millennium of Macroeconomic Data for the UK.” Bank of England, Bank of England, 31 Aug. 2018, www.bankofengland.co.uk/statistics/research-datasets.